SigmaPlot
Analyze statistics and graphing data for scientific programs

- Category Mathematics
- Program license Trial version
- Version 13
- Size 78.38 MB
- Works under: Windows 8
- Program available in English
- Program by Systat
Anyone in any sort of STEM field or any sort of data analysis field often finds themselves having to create charts and graphs with the data uncovered, and the SigmaPlot program is a great way to automatically create these graphs from raw data.
An Overview of SigmaPlot
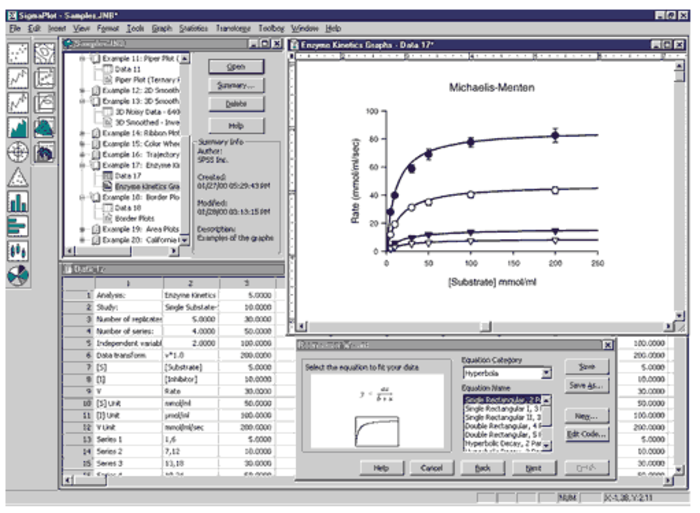
Let's say you're researching something like unemployment numbers under a variety of administrations and you want to display these data via a graph. Typically is the case that you have to hunt down all the relevant data and then will have to get into a program like PhotoShop to create the graph using that data. With the SigmaPlot program, however, you can skip that second step. Rather than using some type of photo/text editor, you simply use the program itself. By loading data into a simple spreadsheet, this program does the rest and actually creates a graph for you automatically.
This is the crux of the program here. It's not going to create anything overly fancy for you. It's not going to find the data for you. But once you do find and input all relevant data, what this program will do for you is create a variety of charts and graphs that allow you to display the data in the sort of visual way that you want. The only real hang-up here in terms of functionality is that this is a paid program. You can get a 30-day trial, but there isn't too much you can do with it. If you want the program to actually use the data you mine to create vivid charts and graphs, then you're going to have to purchase the full size version.
Features of SigmaPlot
Available for the Windows OS and weighing in at about 80MB, the SigmaPlot program is from the Systa development company and is designed with one goal in mind: To create for you a variety of charts and graphs using raw data that it reads from spreadsheets. One of the best things about the program itself is that it will actually run a statistical test of the data for you. In fact, there are over 50 separate tests that the program will run for you. Another great feature of the program is that you can fully integrate it into Microsoft Office. So rather than having to open up a variety of programs to create your graphs, you can simply use your Excel Spreadsheets from Office and have SigmaPlot running inside of your MO. This way, you can simply use one program to create everything you're going to need.
A program like this may necessarily be quite complex, particularly if you don't have a lot of experience. However, this is where the program actually pays for itself in many respects. All you have to do is search the help tab, and you will be linked to a ton of online help articles, tutorials, etc, that will help you get the hang of using the program.
What SigmaPlot is and How it Works
Pros and Cons of SigmaPlot
Pros
- Creates complete graphs from only data
- Can create an assortment of graphs
- Runs 50 different analysis tests
- Can plug right into Office
Cons
- Steep learning curve
- Free trial version is pointless